Archive
Apache Zeppelin “the notebook” on top of all the (Big) Data
Apache Zeppelin is a web-based notebook that enables interactive data analytics. You can make beautiful data-driven, interactive and collaborative documents with SQL, Scala or Python and more. However Apache Zeppelin is still an incubator project, I expect a serious boost of notebooks like Apache Zeppelin on top of data processing (like Apache Spark) and data storage (like HDFS, NoSQL and also RDBMS) solutions.
But is Apache Zeppelin covered in the current Hadoop distributions Cloudera, Hortonworks and MapR?
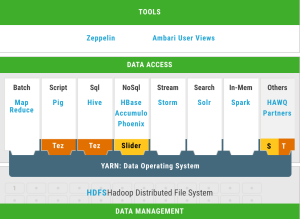
Cloudera is not covering Apache Zeppelin out of the box, but there is blog post how to install Apache Zeppelin on CDH. Hortonworks is covering Apache Zeppelin out of the box, see the picture of the HDP projects (well done Hortonworks). MapR is not covering Apache Zeppelin out of the box, but there is a blog post how to build Apache Zeppelin on MapR.
Is Apache Zeppelin covered by the greatest cloud providers Amazon AWS, Microsoft Azure and Google Cloud Platform?
We see that Amazon Web Services (AWS) has a Platform as a Service solution (PaaS) called Elastic Map Reduce (EMR). We see that since this summer Apache Zeppelin is supported on the EMR release page.
If we look at Microsoft Azure, there is a blog post how to start with Apache Zeppelin on the HD Insights Spark Cluster (this is a also a PaaS solution).
If we look at Google Cloud Platform we see a blog post to install Apache Zeppelin on top of Google BigQuery.
And now a short demo, lets do some data discovery with Apache Zeppelin on an open data set. For this case I use the Fire Report from the City of Amsterdam from 2010 – 2015.
If you want a short intro look first at this short video of Apache Zeppelin (overview).
I use of course docker to start a Zeppelin container. I found an image in the docker hub from Dylan Meissner (thx). Run the docker container to enter the command below:
$ docker run -d -p 8080:8080 dylanmei/zeppelin
Look in the browser at dockerhost:8080 and create a new notebook:
Step 1: Load and unzip the dataset (I use the “shell” interpreter)
%sh
wget https://files.datapress.com/amsterdam/dataset/brandmeldingen-2010-2015/2016-02-25T14:51:13/brwaa_2010-2015.zip -O /tmp/brwaa_2010-2015.zip
%sh
unzip /tmp/brwaa_2010-2015.zip -d /tmp
Step 2: Clean the data, in this case remove the header
%sh
sed -i '1d' /tmp/brwaa_2010-2015.csv
Step 3: Put data into HDFS
%sh
hadoop fs -put /tmp/brwaa_2010-2015.csv /tmp
Step 4: Load the data (most import fields) via a class and use the map function (default Scala)
val dataset=sc.textFile("/tmp/brwaa_2010-2015.csv")
case class Melding (id:  Integer, melding_type: String, jaar: String, maand_nr: String, prioriteit: String, uur: String, dagdeel: String, buurt: String, wijk: String, gemeente: String)
val melding = dataset.map(k=>k.split(";")).map(
k => Melding(k(0).toInt,k(2),k(7),k(8),k(14),k(15),k(16),k(19),k(20),k(22))
)
melding.toDF().registerTempTable("melding_table")
Step 5: Use Spark SQL to run the first query
%sql
select count(*)
from melding_table
Below you can see some more queries and charts:
Next step is how to predict fire with help of Spark ML.
Stream and analyse Tweets with the ELK / Docker stack in 3 simple steps
There are a lot of possibilities with Big Data tools on the today’s market. For example if we want to stream and analyse some tweets there are several ways to do this. For example:
- With the Hadoop ecosystem Flume, Spark, Hive etc. and present it for example with Oracle Big Data Discovery.
- With the Microsoft Stack from Azure (Hadoop) and with Power BI to Excel.
- Or with this blog with the ELK stack (see Elastic) with the help of the Docker ecosystem
- and of course al lot more solutions …
What is the ELK stack? ELK stands for Elasticsearch (Search & Analyze Data in Real Time), Logstash (Process Any Data, From Any Source) and Kibana (Explore & Visualize Your Data). More in info at Elastic.
Most of you know Docker already. Docker allows you to package an application with all of its dependencies into a standarized unit for software development. And … Docker will be more and more import with all kind of Open Source Big Data solutions.
Let’s go for it!
Here are the 3 simple steps:
- Step 1: Install and test Elasticsearch
- Step 2: Install and test Logstash
- Step 3: Install and test Kibana
For now you need only a dockerhost. I use Docker Toolbox.
If you don’t have a virtual machine, create one. For example:
$ docker-machine create --driver virtualbox --virtualbox-disk-size "40000" dev
Logon to the dockerhost (in my case Docker Toolbox)
$ docker-machine ssh dev
Step 1: Install and test Elasticsearch
Install:
docker run --name elasticsearch -p 9200:9200 -d elasticsearch --network.host _non_loopback_
The –network.host _non_loopback_ option must be added from elasticsearch 2.0 to handle localhost
Test:
curl http://localhost:9200
You must see something like:
{
  "status" : 200,
  "name" : "Dragonfly",
  "cluster_name" : "elasticsearch",
  "version" : {
    "number" : "1.7.0",
    "build_hash" : "929b9739cae115e73c346cb5f9a6f24ba735a743",
    "build_timestamp" : "2015-07-16T14:31:07Z",
    "build_snapshot" : false,
    "lucene_version" : "4.10.4"
  },
  "tagline" : "You Know, for Search"
}
Step 2: Install and test Logstash
Make the following “config.conf” file for streaming tweets to elasticsearch. Fill in your twitter credentials and the docker host ip. For this example we search all the tweets with the keyword “elasticsearch”. For now we do not use a filter.
input {
  twitter {
      consumer_key => ""
      consumer_secret => ""
      oauth_token => ""
      oauth_token_secret => ""
      keywords => [ "elasticsearch" ]
      full_tweet => true
  }
}
filter {
}
output {
  stdout { codec => dots }
  elasticsearch {
    protocol => "http"
    host => "<Docker Host IP>"
    index => "twitter"
    document_type => "tweet"
  }
}
Install:
docker run --name logstash -it --rm -v "$PWD":/config logstash logstash
 -f /config/config.conf
Test (if everything went well) you see:
Logstash startup completed
...........
Step 3: Install and test Kibana
Install and link with the elasticsearch container:
docker run --name kibana --link elasticsearch:elasticsearch -p 5601:5601 -d kibana
Test:
curl http://localhost:5601
You must see something like a html page. Go to a browser and see the Kibana 4 user interface.
Start to go to settings tab and enter the new index name “twitter”
Go to the discover tab and you see something like this (after 60 minutes):
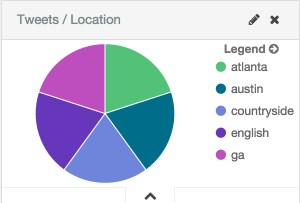
I also make a pie chart (Tweets per Location) like this:
And there are a lot of more possibilities with the ELK stack. Enjoy!
More info:


